Playground for Parameters
[2]:
from cmos_noise_map.utils.get_rts_playground import plot_get_rts, noise_distribution
from cmos_noise_map.utils.read_write_utils import read_write_utils
from cmos_noise_map.utils.data_utils import data_to_pixel
import os
import requests
Download test data from archive (only need to run once!)
[3]:
if not os.path.exists(os.path.join('get_rts_testdata/')):
    os.mkdir(os.path.join('get_rts_testdata/'), mode=0o777)
    write_path = os.path.join('get_rts_testdata/')
    archive_record = requests.get(f'https://archive-api.lco.global/frames/?reduction_level=91&instrument_id=sq30&configuration_type=BIAS&basename=b91&start=2023-01-03%2000%3A00&end=2023-02-01%2023%3A59&public=true').json()['results'][:15]
    for rec in archive_record:
        #Give path to write files to
        with open(f'{write_path}/{rec["filename"]}', 'wb') as f:
            f.write(requests.get(rec['url']).content)
else:
    write_path = os.path.join('get_rts_testdata/')
Read the files into memory
[4]:
#Memory map files in:
write_path = os.path.join('get_rts_testdata/')
images = read_write_utils(write_path, filename=None, data_ext=0, fpack=True).read_bias_frames
To use this notebook on your own data, run something like this:
path = path_to_files
data_ext = data_ext
#Memory map files in:
images = read_bias_frames(path, data_ext=data_ext)
Determining –upper_quantile
The upper_quantile quantity indicates the minimum noisiness of the pixel (calculated by taking the standard deviation across images) for it to be evaluated for a random telegraph signal. This cutoff is made at the tail of the right side of a detector noise distribution. This tail is where we see RTS affected pixels. The plot below is inteded to help determine the right upper_quantile cutoff point for your data, as it can vary depending on the dataset. It is highly recommended that
the user set this. By default it is at the 80th percentile.
[5]:
dist = noise_distribution(images, gain=None, data_ext=0)
dist.noise_distribution_plot(upper_quantile=0.80, bins=1000)
/home/pkottapalli/cmos-noise-map/cmos_noise_map/utils/get_rts_playground.py:298: UserWarning: Matplotlib is currently using module://matplotlib_inline.backend_inline, which is a non-GUI backend, so cannot show the figure.
  fig.show()
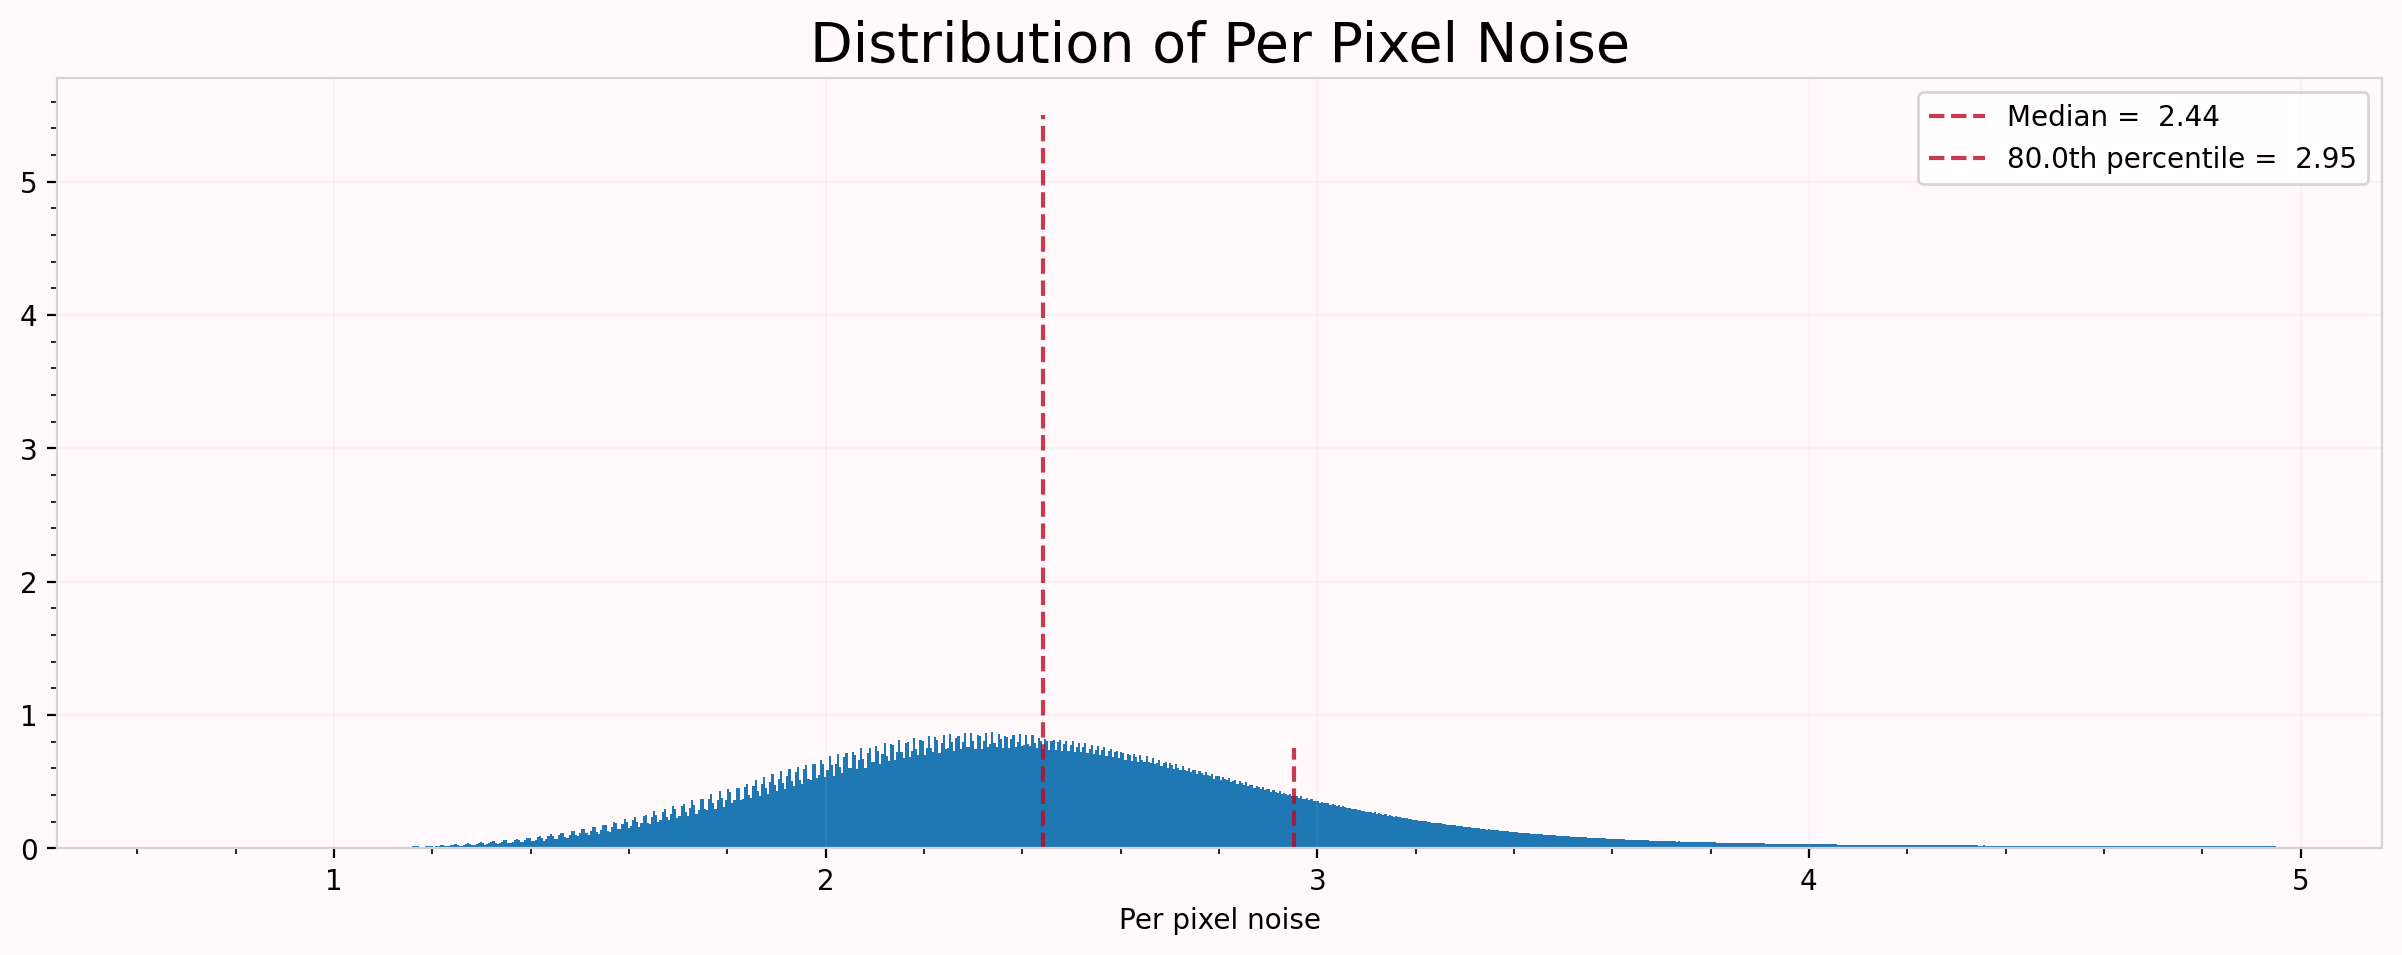
Above, we can see that the 80th percentile doesn’t necessarily capture the tail of the distribution. If we go ahead with this, we risk overfitting normal pixels, and modelling them as multimodal. Even if we don’t overfit, we are wasting valuable time and computational resources! Let’s try again with a 90th percentile cutoff.
[6]:
dist.noise_distribution_plot(upper_quantile=0.90, bins=1000)
/home/pkottapalli/cmos-noise-map/cmos_noise_map/utils/get_rts_playground.py:298: UserWarning: Matplotlib is currently using module://matplotlib_inline.backend_inline, which is a non-GUI backend, so cannot show the figure.
  fig.show()

This better cuts off the tail, so we can use this as our cutoff and rest assured that we are capturing most RTS affected pixels, while not wasting computational resources.
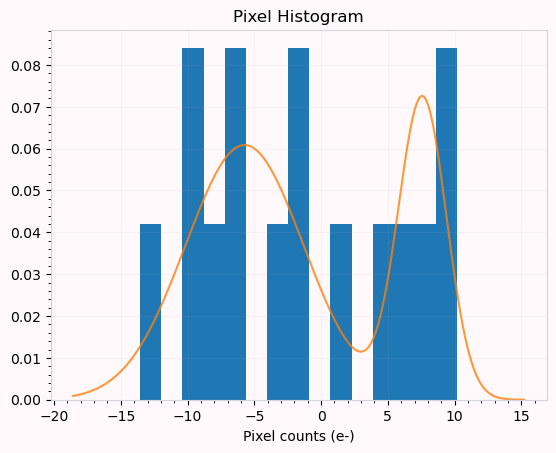
Determining –tolerance and –min_peak_separation
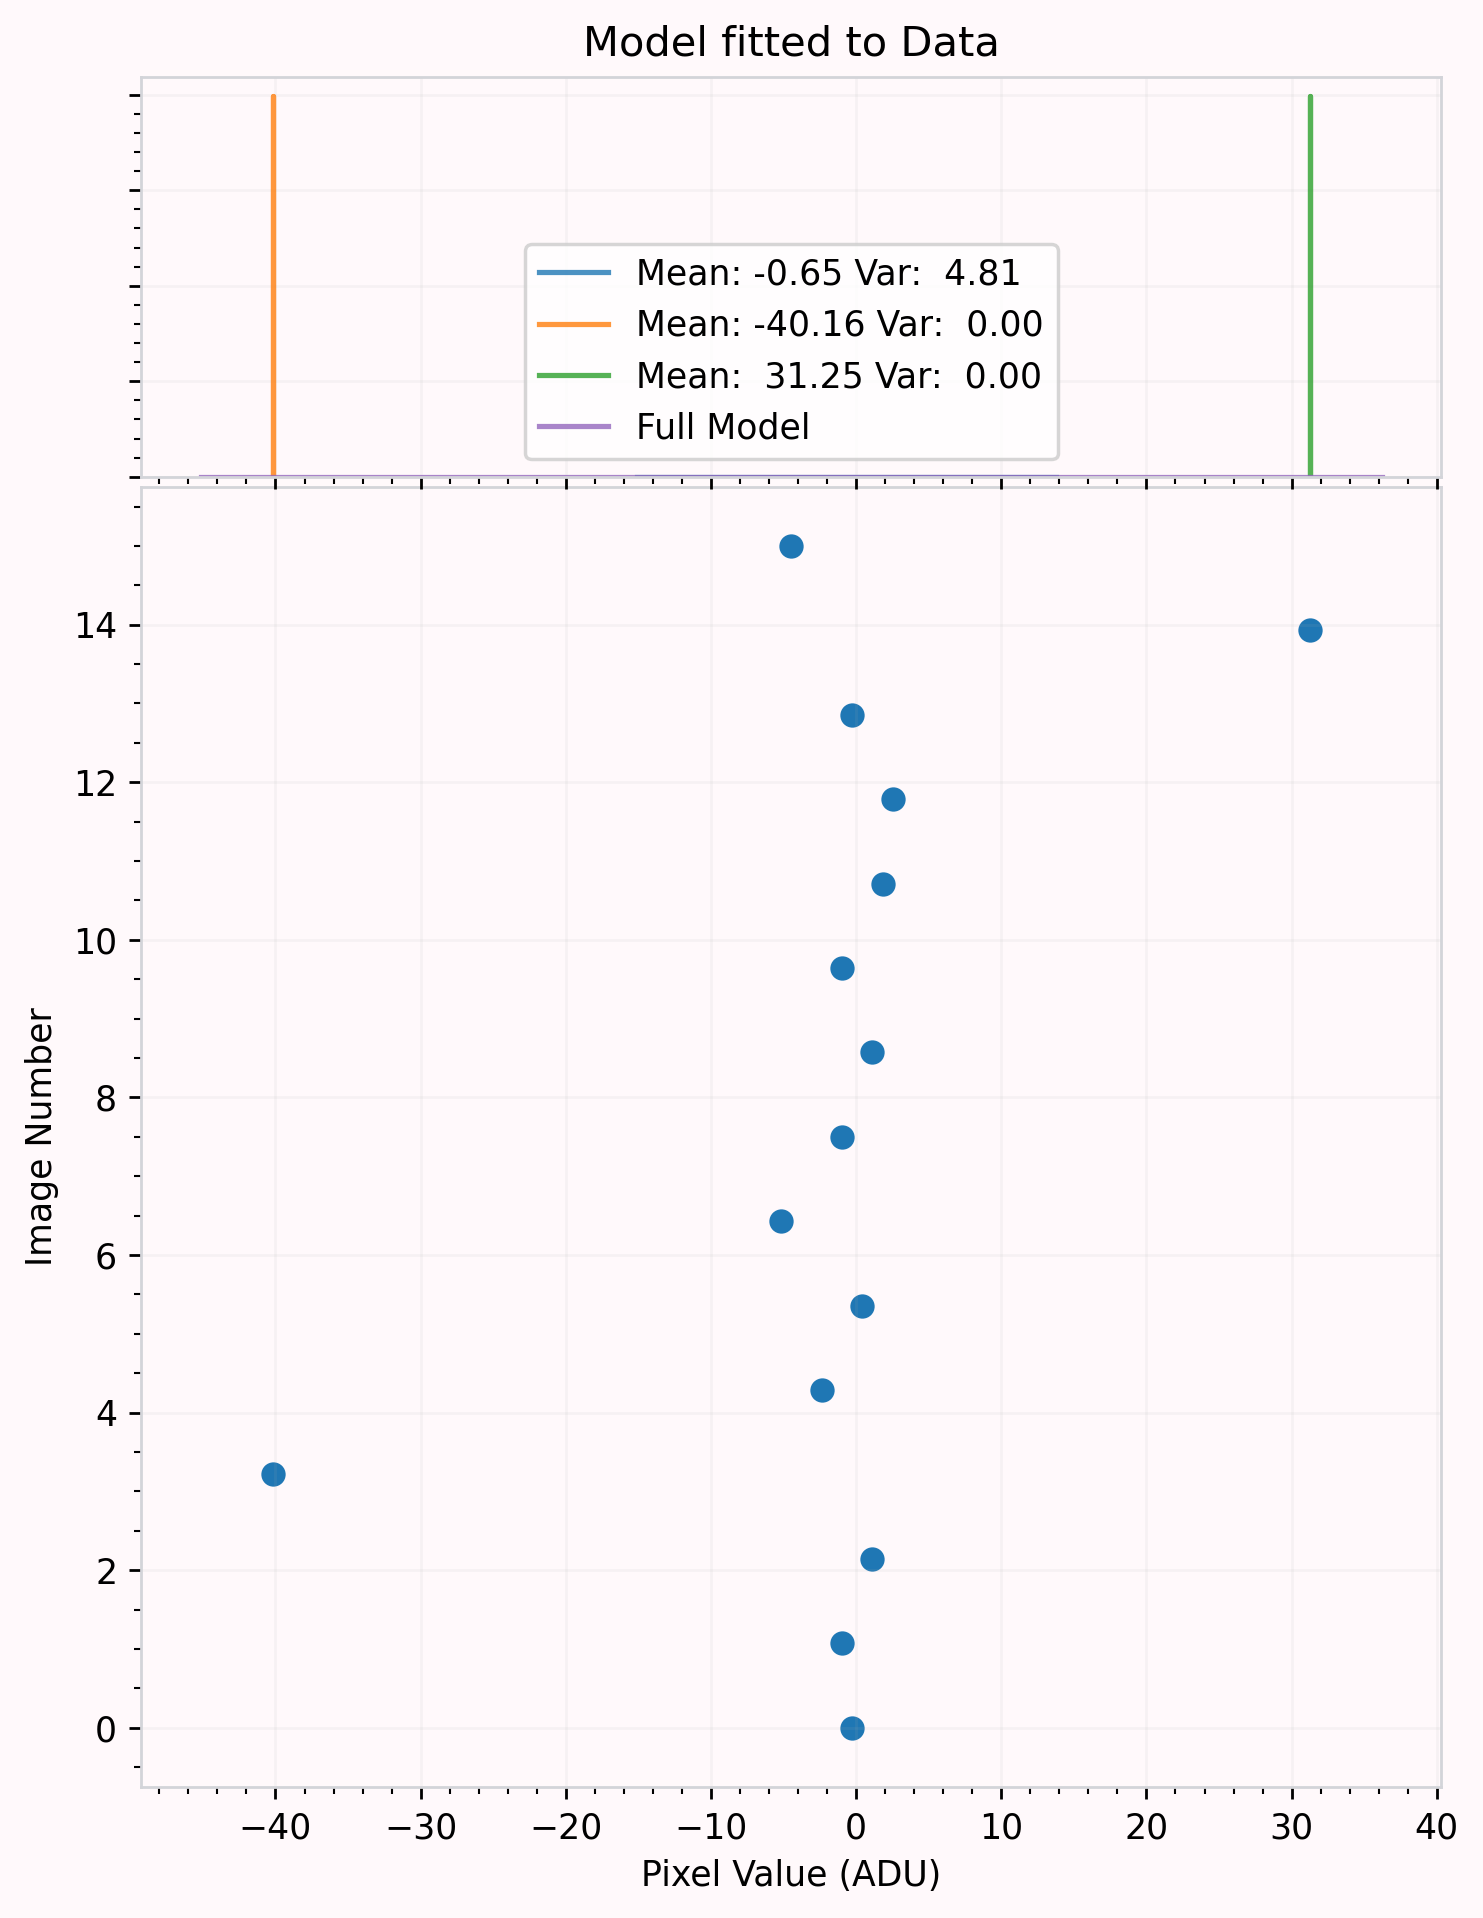
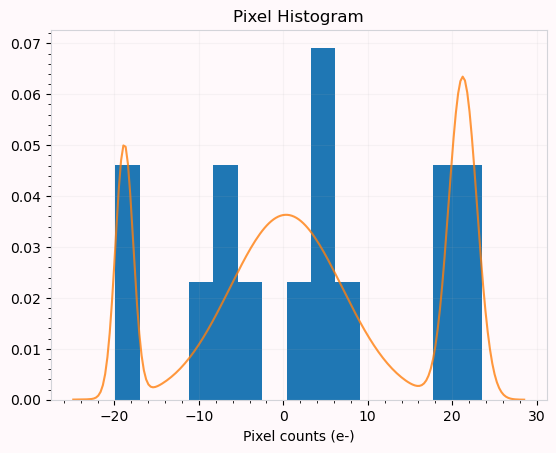
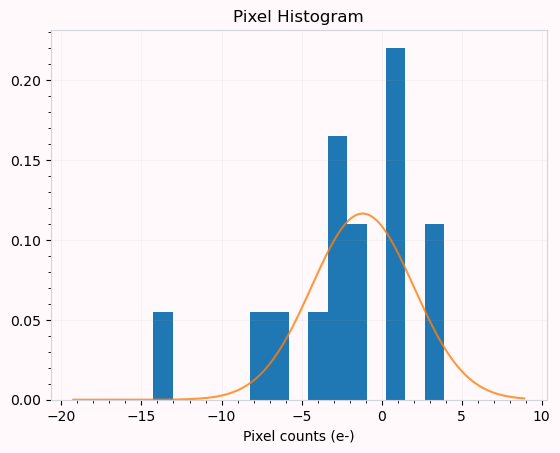
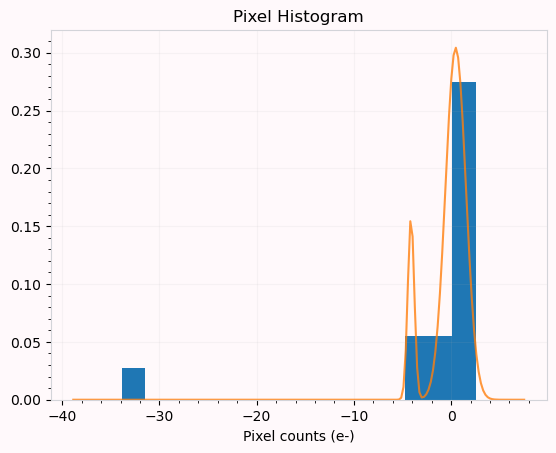
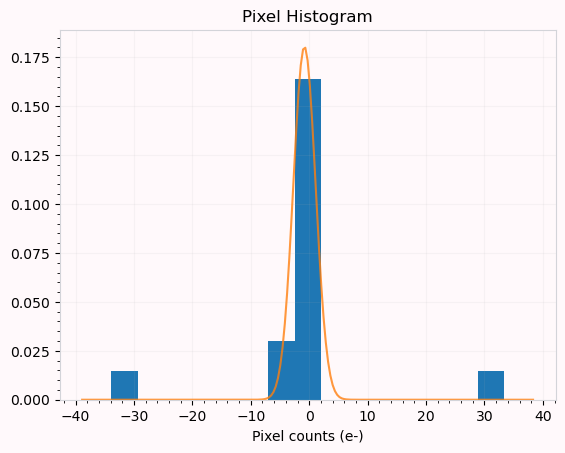
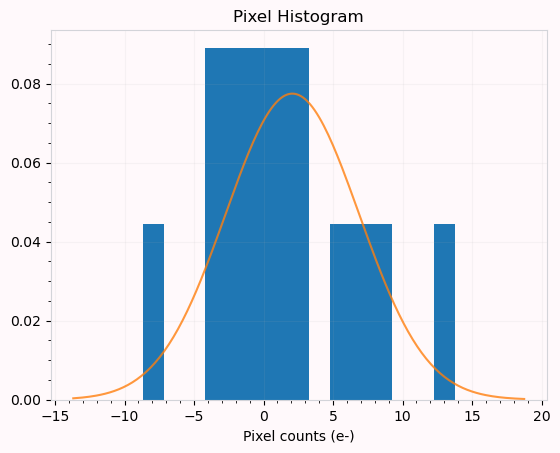
Generally we don’t need to change the tolerance parameter, but the min_peak_separation might be good to change depending on your data and the units. Let’s look at one row. This is usually plenty of data to find good looking multimodal RTS affected pixels. We’ll also use the upper_quantile determined above! tolerance and min_peak_separation will be left at their defaults.
Note depending on how much data you’re passing through, you might wanna force stop this cell when you think you’ve seen enough.
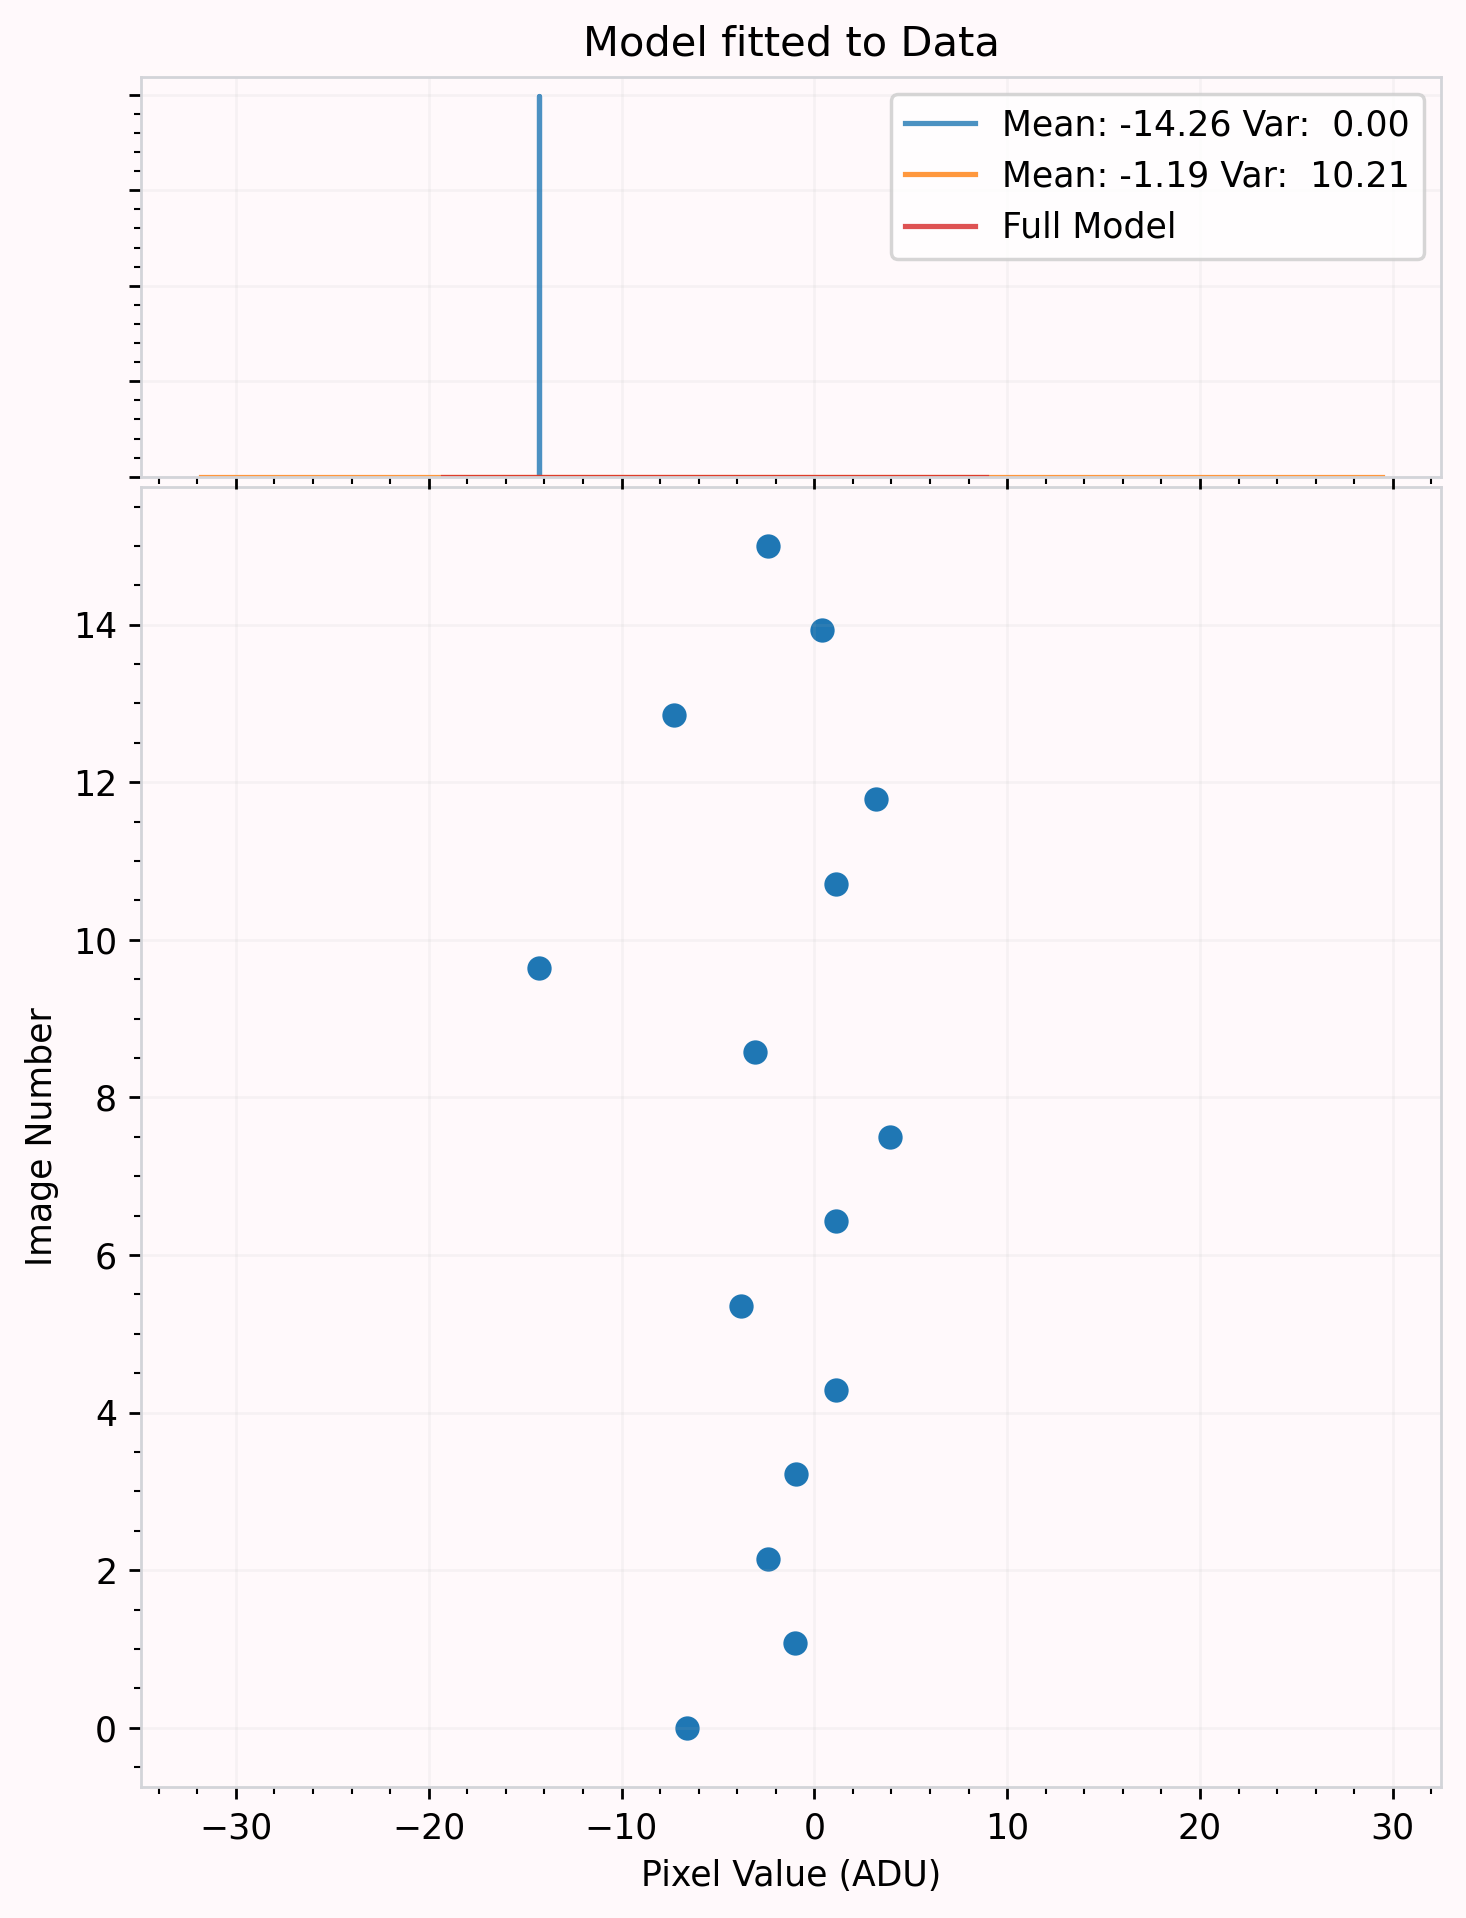
[7]:
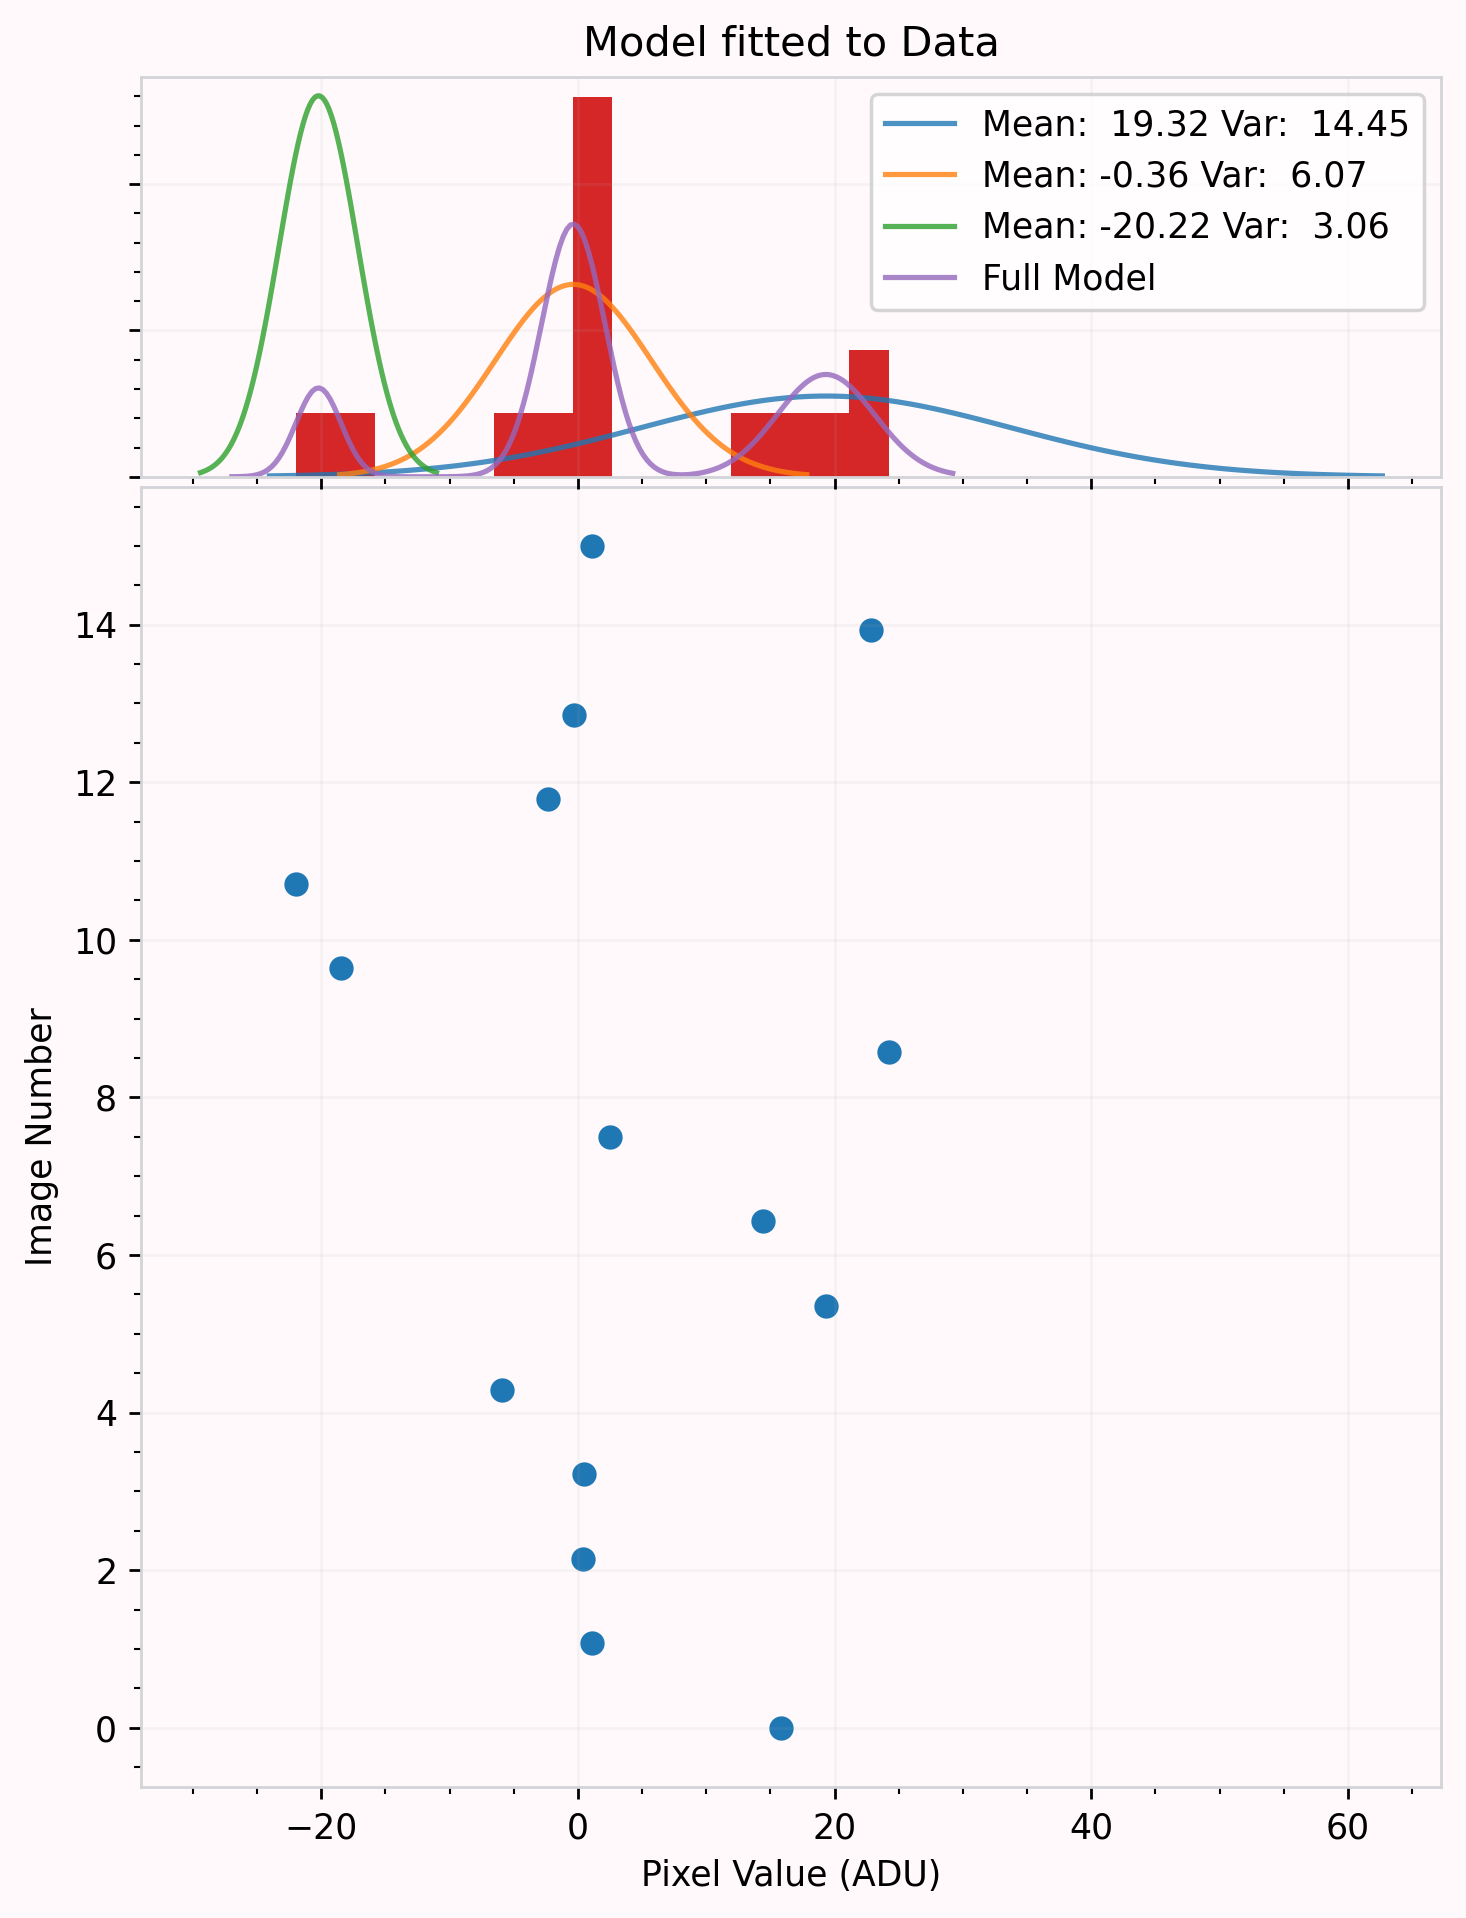
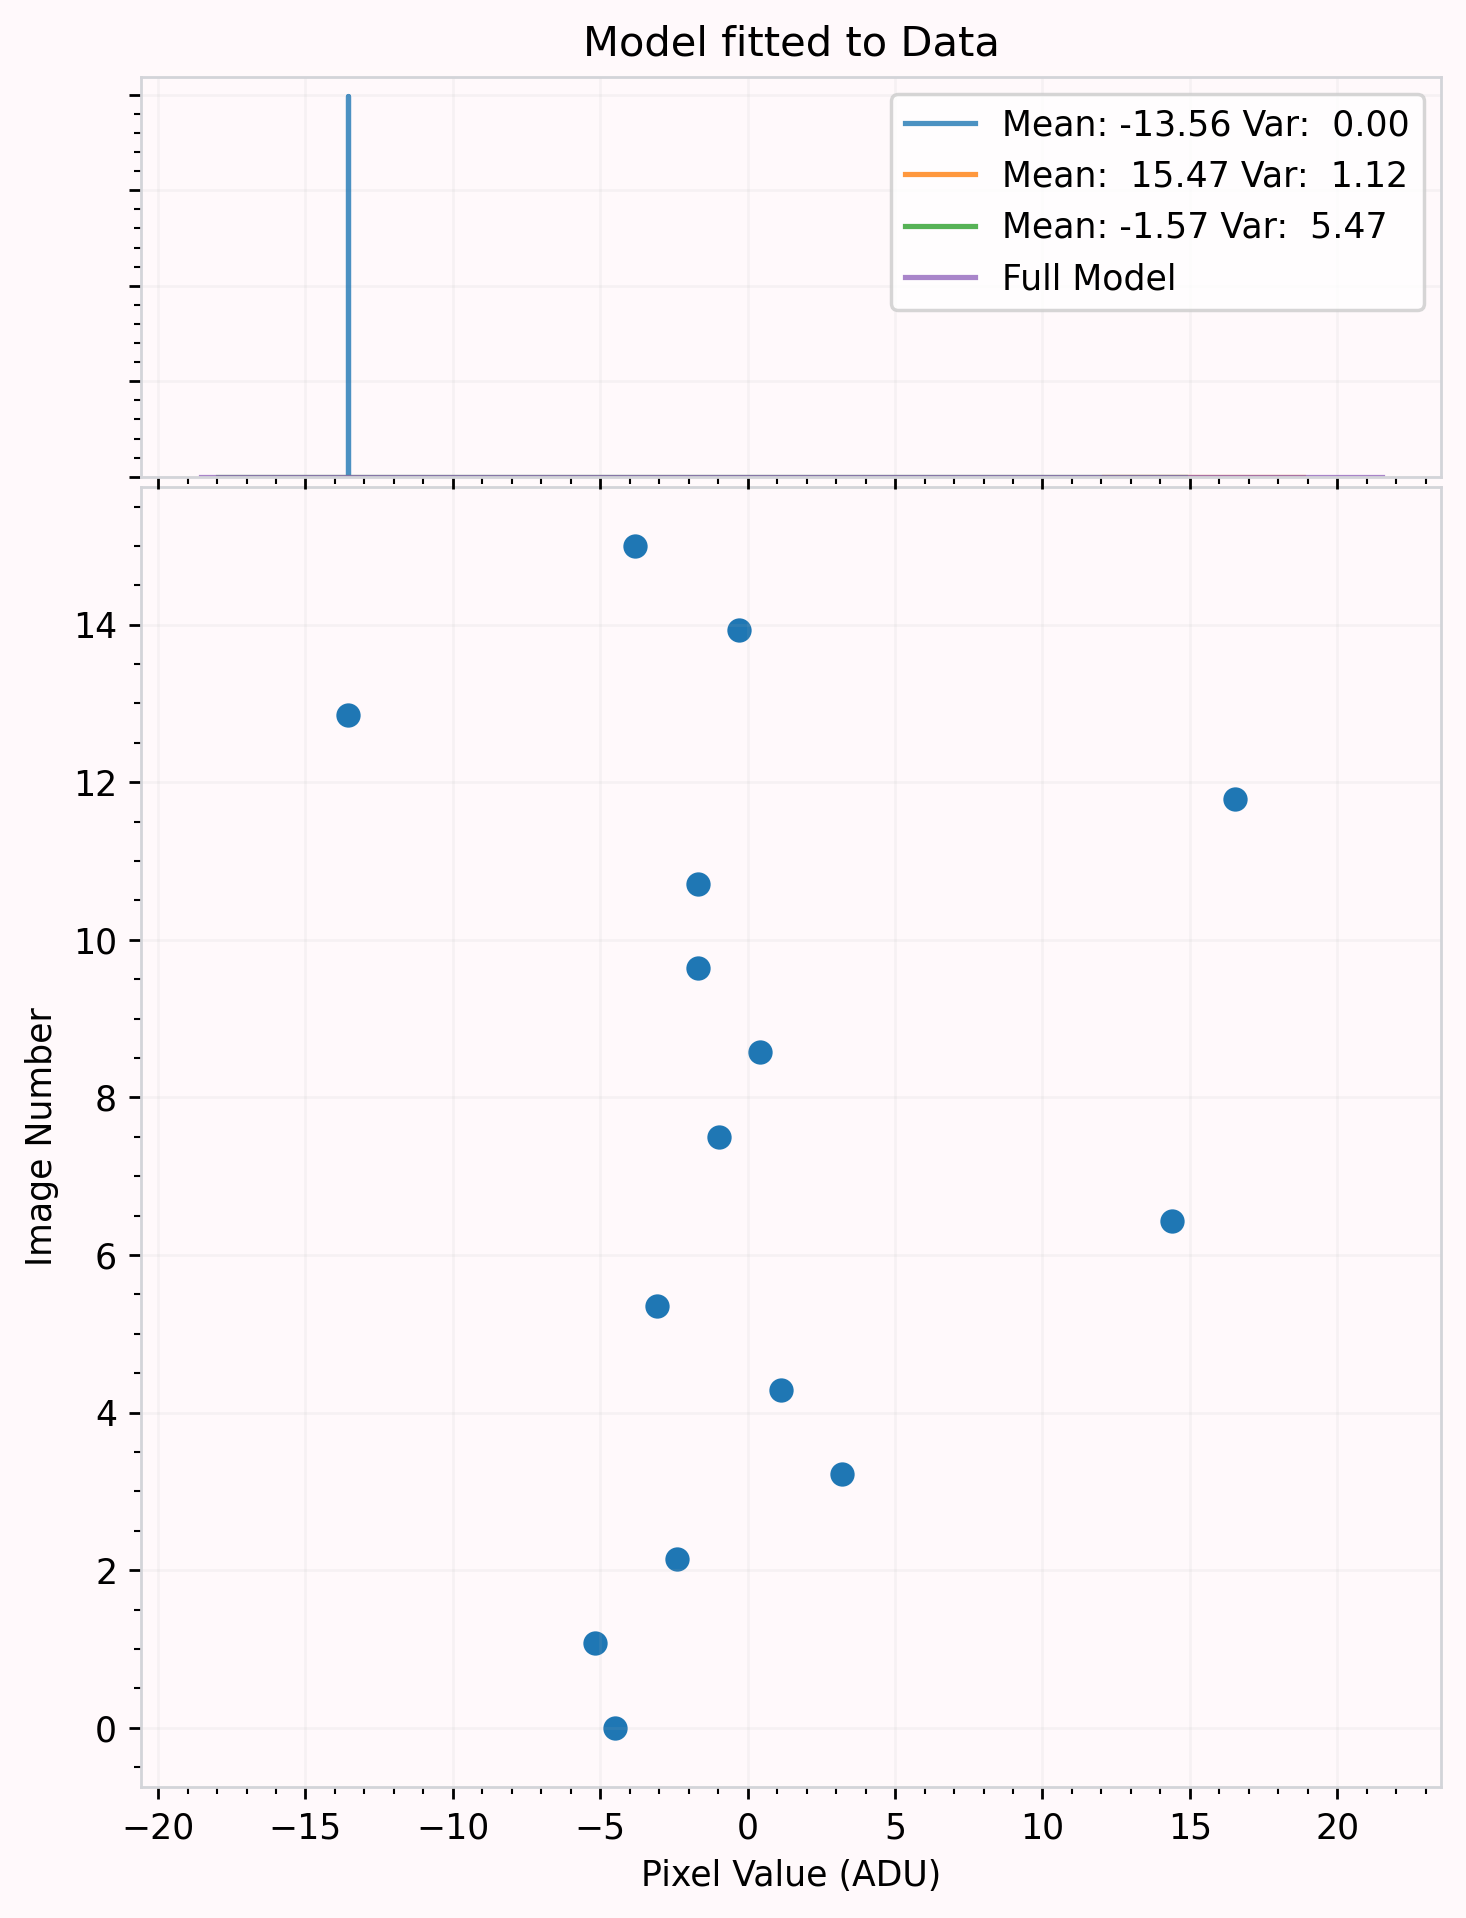
rts = plot_get_rts(images, data_ext=1, start_row=0, end_row=1, start_column=0, end_column=5)
rts.plot(tolerance=0.05, upper_quantile=3.86, min_peak_separation=10)
/home/pkottapalli/cmos-noise-map/cmos_noise_map/utils/get_rts_playground.py:163: UserWarning: Matplotlib is currently using module://matplotlib_inline.backend_inline, which is a non-GUI backend, so cannot show the figure.
  fig.show()
/home/pkottapalli/cmos-noise-map/cmos_noise_map/utils/get_rts_playground.py:163: UserWarning: Matplotlib is currently using module://matplotlib_inline.backend_inline, which is a non-GUI backend, so cannot show the figure.
  fig.show()


/home/pkottapalli/cmos-noise-map/cmos_noise_map/utils/get_rts_playground.py:163: UserWarning: Matplotlib is currently using module://matplotlib_inline.backend_inline, which is a non-GUI backend, so cannot show the figure.
  fig.show()


/home/pkottapalli/cmos-noise-map/cmos_noise_map/utils/get_rts_playground.py:163: UserWarning: Matplotlib is currently using module://matplotlib_inline.backend_inline, which is a non-GUI backend, so cannot show the figure.
  fig.show()


/home/pkottapalli/cmos-noise-map/cmos_noise_map/utils/get_rts_playground.py:163: UserWarning: Matplotlib is currently using module://matplotlib_inline.backend_inline, which is a non-GUI backend, so cannot show the figure.
  fig.show()
/home/pkottapalli/cmos-noise-map/cmos_noise_map/utils/get_rts_playground.py:163: UserWarning: Matplotlib is currently using module://matplotlib_inline.backend_inline, which is a non-GUI backend, so cannot show the figure.
  fig.show()
/home/pkottapalli/cmos-noise-map/cmos_noise_map/utils/get_rts_playground.py:163: UserWarning: Matplotlib is currently using module://matplotlib_inline.backend_inline, which is a non-GUI backend, so cannot show the figure.
  fig.show()
/home/pkottapalli/cmos-noise-map/cmos_noise_map/utils/get_rts_playground.py:163: UserWarning: Matplotlib is currently using module://matplotlib_inline.backend_inline, which is a non-GUI backend, so cannot show the figure.
  fig.show()

/home/pkottapalli/cmos-noise-map/cmos_noise_map/utils/get_rts_playground.py:163: UserWarning: Matplotlib is currently using module://matplotlib_inline.backend_inline, which is a non-GUI backend, so cannot show the figure.
  fig.show()
/home/pkottapalli/cmos-noise-map/cmos_noise_map/utils/get_rts_playground.py:163: UserWarning: Matplotlib is currently using module://matplotlib_inline.backend_inline, which is a non-GUI backend, so cannot show the figure.
  fig.show()


/home/pkottapalli/cmos-noise-map/cmos_noise_map/utils/get_rts_playground.py:163: UserWarning: Matplotlib is currently using module://matplotlib_inline.backend_inline, which is a non-GUI backend, so cannot show the figure.
  fig.show()


/home/pkottapalli/cmos-noise-map/cmos_noise_map/utils/get_rts_playground.py:163: UserWarning: Matplotlib is currently using module://matplotlib_inline.backend_inline, which is a non-GUI backend, so cannot show the figure.
  fig.show()

/home/pkottapalli/cmos-noise-map/cmos_noise_map/utils/get_rts_playground.py:163: UserWarning: Matplotlib is currently using module://matplotlib_inline.backend_inline, which is a non-GUI backend, so cannot show the figure.
  fig.show()

/home/pkottapalli/cmos-noise-map/cmos_noise_map/utils/get_rts_playground.py:163: UserWarning: Matplotlib is currently using module://matplotlib_inline.backend_inline, which is a non-GUI backend, so cannot show the figure.
  fig.show()

/home/pkottapalli/cmos-noise-map/cmos_noise_map/utils/get_rts_playground.py:163: UserWarning: Matplotlib is currently using module://matplotlib_inline.backend_inline, which is a non-GUI backend, so cannot show the figure.
  fig.show()
---------------------------------------------------------------------------
KeyboardInterrupt                         Traceback (most recent call last)
/tmp/ipykernel_27420/379647782.py in <module>
      1 rts = plot_get_rts(images, data_ext=1, start_row=0, end_row=1, start_column=None, end_column=None)
----> 2 rts.plot(tolerance=0.05, upper_quantile=3.86, min_peak_separation=10)

~/cmos-noise-map/cmos_noise_map/utils/get_rts_playground.py in plot(self, tolerance, upper_quantile, min_peak_separation)
    223                     plt.legend()
    224                     plt.title("Model fitted to Data")
--> 225                     plt.show()
    226
    227

~/anaconda3/lib/python3.9/site-packages/matplotlib/pyplot.py in show(*args, **kwargs)
    385     """
    386     _warn_if_gui_out_of_main_thread()
--> 387     return _get_backend_mod().show(*args, **kwargs)
    388
    389

~/anaconda3/lib/python3.9/site-packages/matplotlib_inline/backend_inline.py in show(close, block)
     88     try:
     89         for figure_manager in Gcf.get_all_fig_managers():
---> 90             display(
     91                 figure_manager.canvas.figure,
     92                 metadata=_fetch_figure_metadata(figure_manager.canvas.figure)

~/anaconda3/lib/python3.9/site-packages/IPython/core/display.py in display(include, exclude, metadata, transient, display_id, *objs, **kwargs)
    318             publish_display_data(data=obj, metadata=metadata, **kwargs)
    319         else:
--> 320             format_dict, md_dict = format(obj, include=include, exclude=exclude)
    321             if not format_dict:
    322                 # nothing to display (e.g. _ipython_display_ took over)

~/anaconda3/lib/python3.9/site-packages/IPython/core/formatters.py in format(self, obj, include, exclude)
    178             md = None
    179             try:
--> 180                 data = formatter(obj)
    181             except:
    182                 # FIXME: log the exception

~/anaconda3/lib/python3.9/site-packages/decorator.py in fun(*args, **kw)
    230             if not kwsyntax:
    231                 args, kw = fix(args, kw, sig)
--> 232             return caller(func, *(extras + args), **kw)
    233     fun.__name__ = func.__name__
    234     fun.__doc__ = func.__doc__

~/anaconda3/lib/python3.9/site-packages/IPython/core/formatters.py in catch_format_error(method, self, *args, **kwargs)
    222     """show traceback on failed format call"""
    223     try:
--> 224         r = method(self, *args, **kwargs)
    225     except NotImplementedError:
    226         # don't warn on NotImplementedErrors

~/anaconda3/lib/python3.9/site-packages/IPython/core/formatters.py in __call__(self, obj)
    339                 pass
    340             else:
--> 341                 return printer(obj)
    342             # Finally look for special method names
    343             method = get_real_method(obj, self.print_method)

~/anaconda3/lib/python3.9/site-packages/IPython/core/pylabtools.py in print_figure(fig, fmt, bbox_inches, base64, **kwargs)
    149         FigureCanvasBase(fig)
    150
--> 151     fig.canvas.print_figure(bytes_io, **kw)
    152     data = bytes_io.getvalue()
    153     if fmt == 'svg':

~/anaconda3/lib/python3.9/site-packages/matplotlib/backend_bases.py in print_figure(self, filename, dpi, facecolor, edgecolor, orientation, format, bbox_inches, pad_inches, bbox_extra_artists, backend, **kwargs)
   2317                 # force the figure dpi to 72), so we need to set it again here.
   2318                 with cbook._setattr_cm(self.figure, dpi=dpi):
-> 2319                     result = print_method(
   2320                         filename,
   2321                         facecolor=facecolor,

~/anaconda3/lib/python3.9/site-packages/matplotlib/backend_bases.py in wrapper(*args, **kwargs)
   1646             kwargs.pop(arg)
   1647
-> 1648         return func(*args, **kwargs)
   1649
   1650     return wrapper

~/anaconda3/lib/python3.9/site-packages/matplotlib/_api/deprecation.py in wrapper(*inner_args, **inner_kwargs)
    413                          else deprecation_addendum,
    414                 **kwargs)
--> 415         return func(*inner_args, **inner_kwargs)
    416
    417     DECORATORS[wrapper] = decorator

~/anaconda3/lib/python3.9/site-packages/matplotlib/backends/backend_agg.py in print_png(self, filename_or_obj, metadata, pil_kwargs, *args)
    538             *metadata*, including the default 'Software' key.
    539         """
--> 540         FigureCanvasAgg.draw(self)
    541         mpl.image.imsave(
    542             filename_or_obj, self.buffer_rgba(), format="png", origin="upper",

~/anaconda3/lib/python3.9/site-packages/matplotlib/backends/backend_agg.py in draw(self)
    434              (self.toolbar._wait_cursor_for_draw_cm() if self.toolbar
    435               else nullcontext()):
--> 436             self.figure.draw(self.renderer)
    437             # A GUI class may be need to update a window using this draw, so
    438             # don't forget to call the superclass.

~/anaconda3/lib/python3.9/site-packages/matplotlib/artist.py in draw_wrapper(artist, renderer, *args, **kwargs)
     72     @wraps(draw)
     73     def draw_wrapper(artist, renderer, *args, **kwargs):
---> 74         result = draw(artist, renderer, *args, **kwargs)
     75         if renderer._rasterizing:
     76             renderer.stop_rasterizing()

~/anaconda3/lib/python3.9/site-packages/matplotlib/artist.py in draw_wrapper(artist, renderer)
     49                 renderer.start_filter()
     50
---> 51             return draw(artist, renderer)
     52         finally:
     53             if artist.get_agg_filter() is not None:

~/anaconda3/lib/python3.9/site-packages/matplotlib/figure.py in draw(self, renderer)
   2843
   2844             self.patch.draw(renderer)
-> 2845             mimage._draw_list_compositing_images(
   2846                 renderer, self, artists, self.suppressComposite)
   2847

~/anaconda3/lib/python3.9/site-packages/matplotlib/image.py in _draw_list_compositing_images(renderer, parent, artists, suppress_composite)
    130     if not_composite or not has_images:
    131         for a in artists:
--> 132             a.draw(renderer)
    133     else:
    134         # Composite any adjacent images together

~/anaconda3/lib/python3.9/site-packages/matplotlib/artist.py in draw_wrapper(artist, renderer)
     49                 renderer.start_filter()
     50
---> 51             return draw(artist, renderer)
     52         finally:
     53             if artist.get_agg_filter() is not None:

~/anaconda3/lib/python3.9/site-packages/matplotlib/axes/_base.py in draw(self, renderer)
   3053                 artists.remove(spine)
   3054
-> 3055         self._update_title_position(renderer)
   3056
   3057         if not self.axison:

~/anaconda3/lib/python3.9/site-packages/matplotlib/axes/_base.py in _update_title_position(self, renderer)
   2997                         bb = ax.get_window_extent(renderer)
   2998                 if bb is not None:
-> 2999                     top = max(top, bb.ymax)
   3000             if top < 0:
   3001                 # the top of Axes is not even on the figure, so don't try and

~/anaconda3/lib/python3.9/site-packages/matplotlib/transforms.py in ymax(self)
    342     def ymax(self):
    343         """The top edge of the bounding box."""
--> 344         return np.max(self.get_points()[:, 1])
    345
    346     @property

<__array_function__ internals> in amax(*args, **kwargs)

~/anaconda3/lib/python3.9/site-packages/numpy/core/fromnumeric.py in amax(a, axis, out, keepdims, initial, where)
   2752     5
   2753     """
-> 2754     return _wrapreduction(a, np.maximum, 'max', axis, None, out,
   2755                           keepdims=keepdims, initial=initial, where=where)
   2756

~/anaconda3/lib/python3.9/site-packages/numpy/core/fromnumeric.py in _wrapreduction(obj, ufunc, method, axis, dtype, out, **kwargs)
     84                 return reduction(axis=axis, out=out, **passkwargs)
     85
---> 86     return ufunc.reduce(obj, axis, dtype, out, **passkwargs)
     87
     88

KeyboardInterrupt:
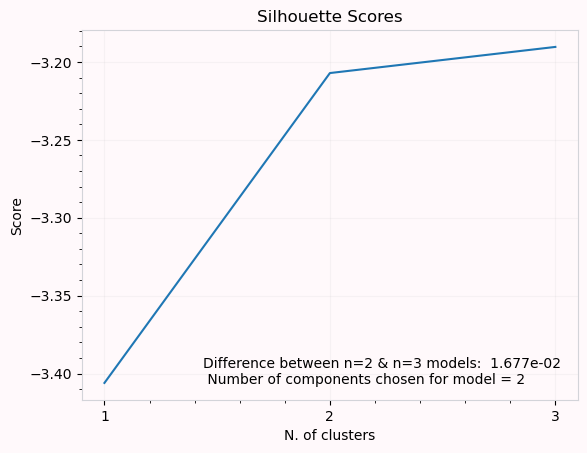
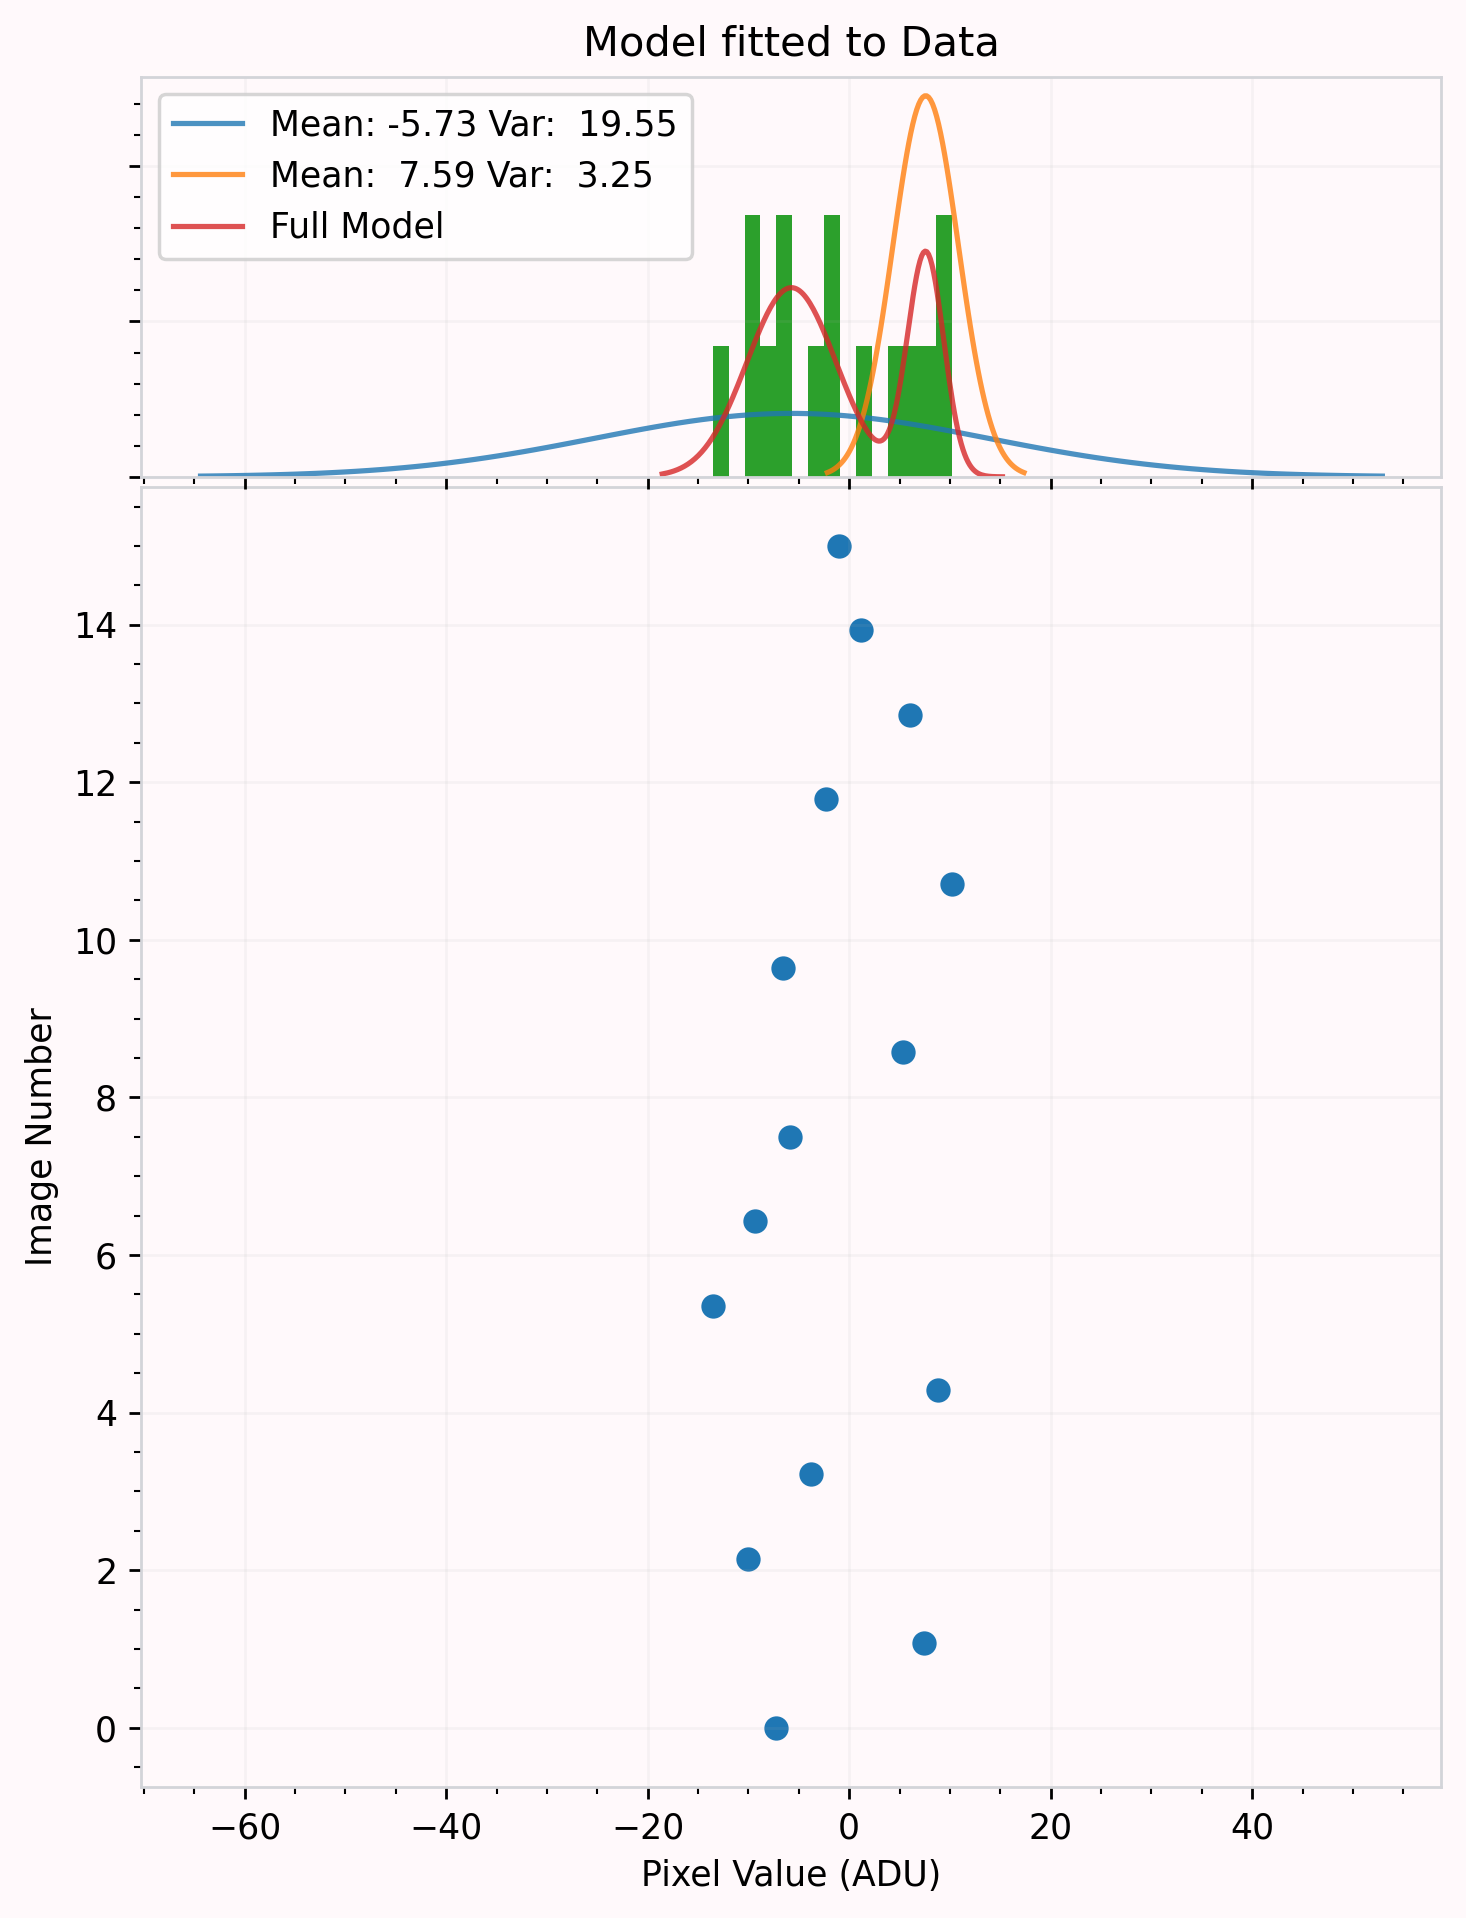
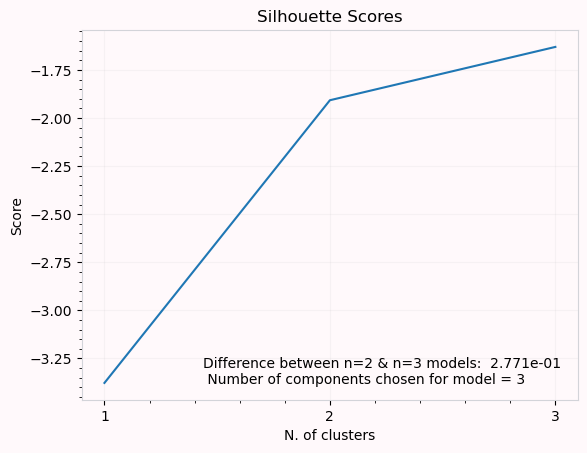
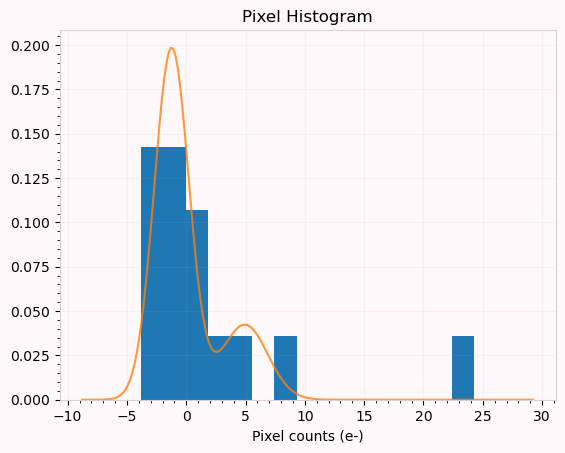
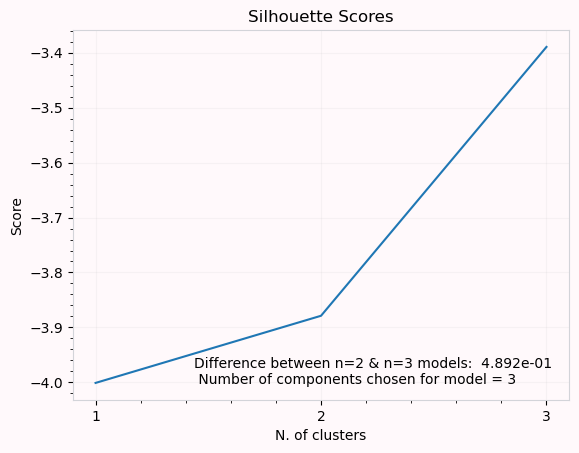
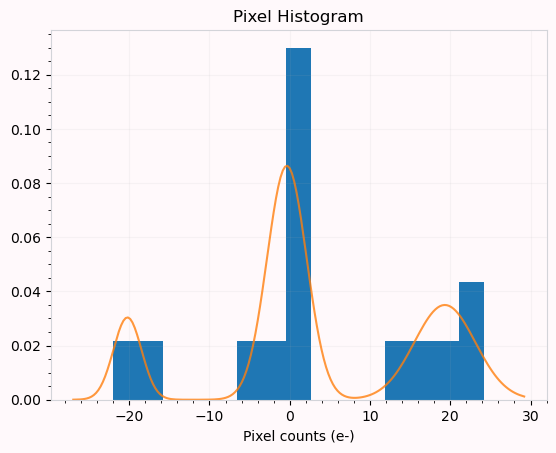
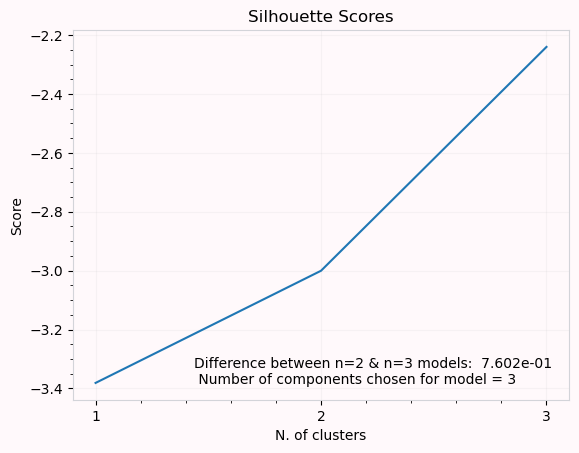
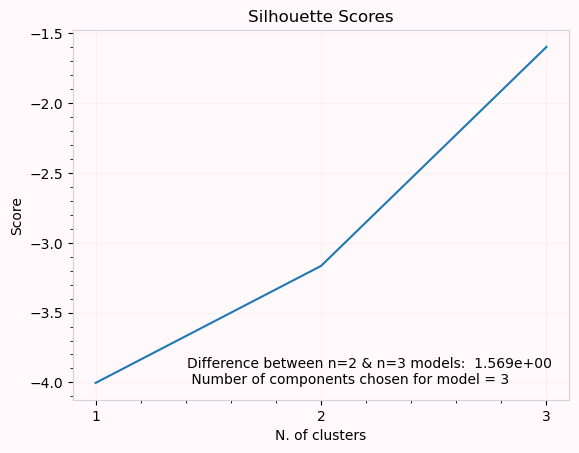
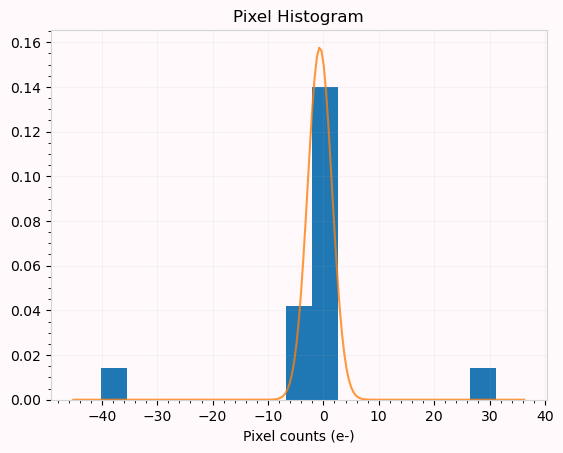
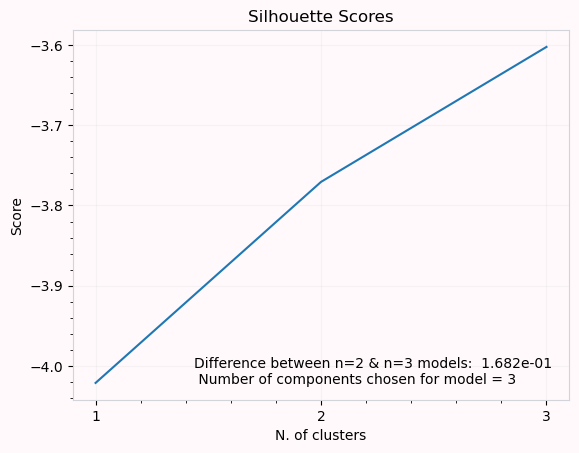
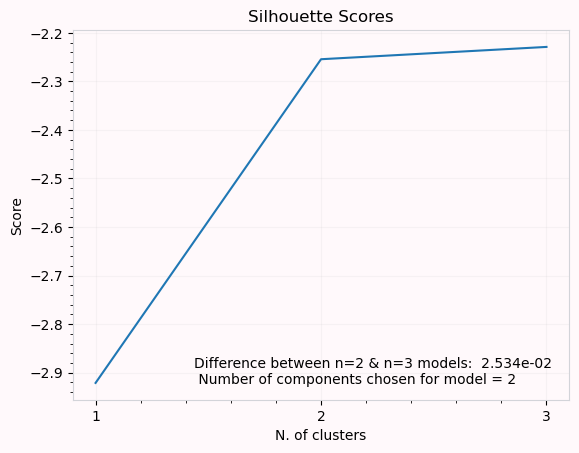
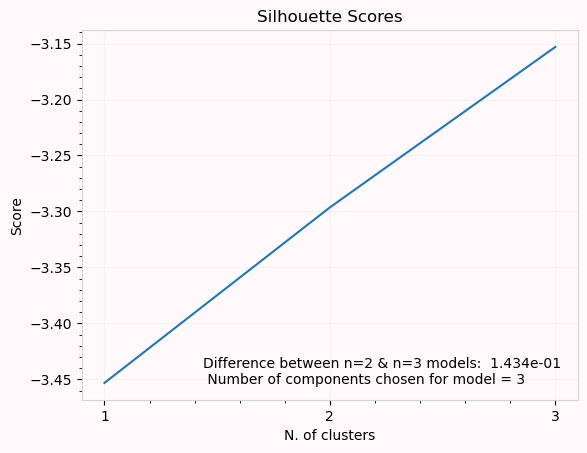
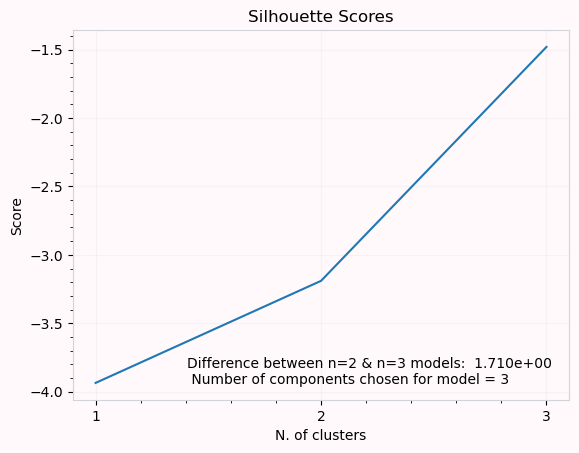
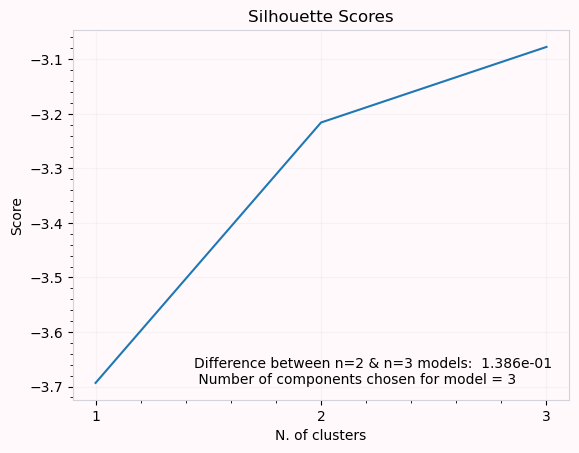
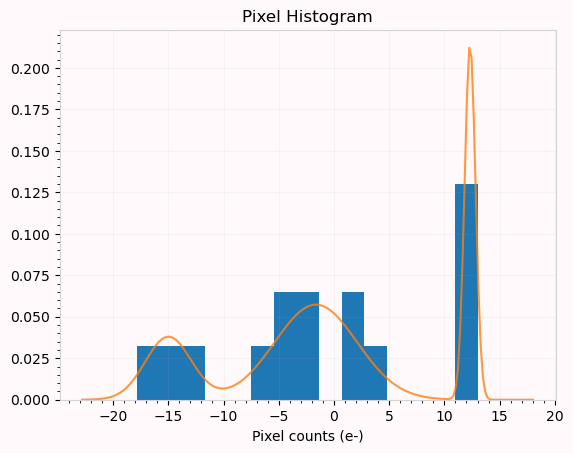
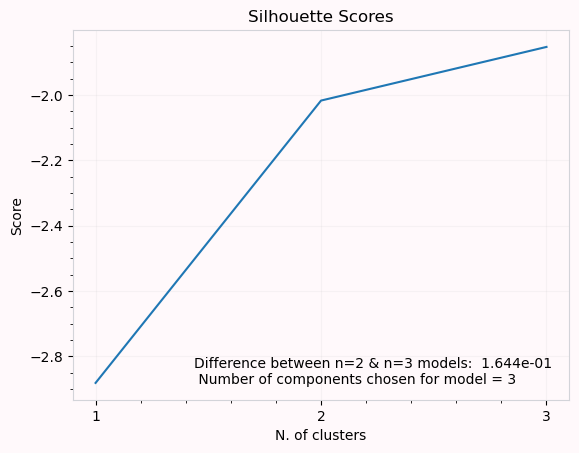
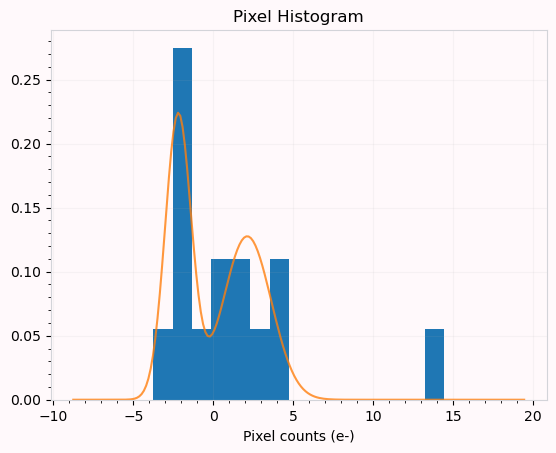
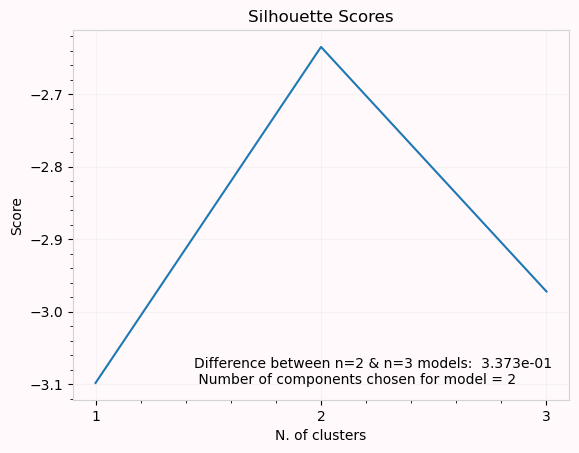
We can see that some well defined peaks are at least 20 ADU apart. We can then estimate that for this data, that the minimum peak separation should be about 10 ADU. When we look at the ‘Silhouette Score’ plot, we can see that between the models for 2 and 3 components the score difference isn’t very large. To avoid overfitting we want to ensure we always choose a model with 2 components when this happens. Setting the tolerance to 0.05, we say that the minimum difference between these two
components should be at least 0.05 for us to say confidently that a model with 3 components is more appropriate.